Zephyr Climate Brief
A compact climate research publication template with evidence chart, uncertainty, regional signals, methods, policy watch, and datasets
A compact climate research publication template with evidence chart, uncertainty, regional signals, methods, policy watch, and datasets
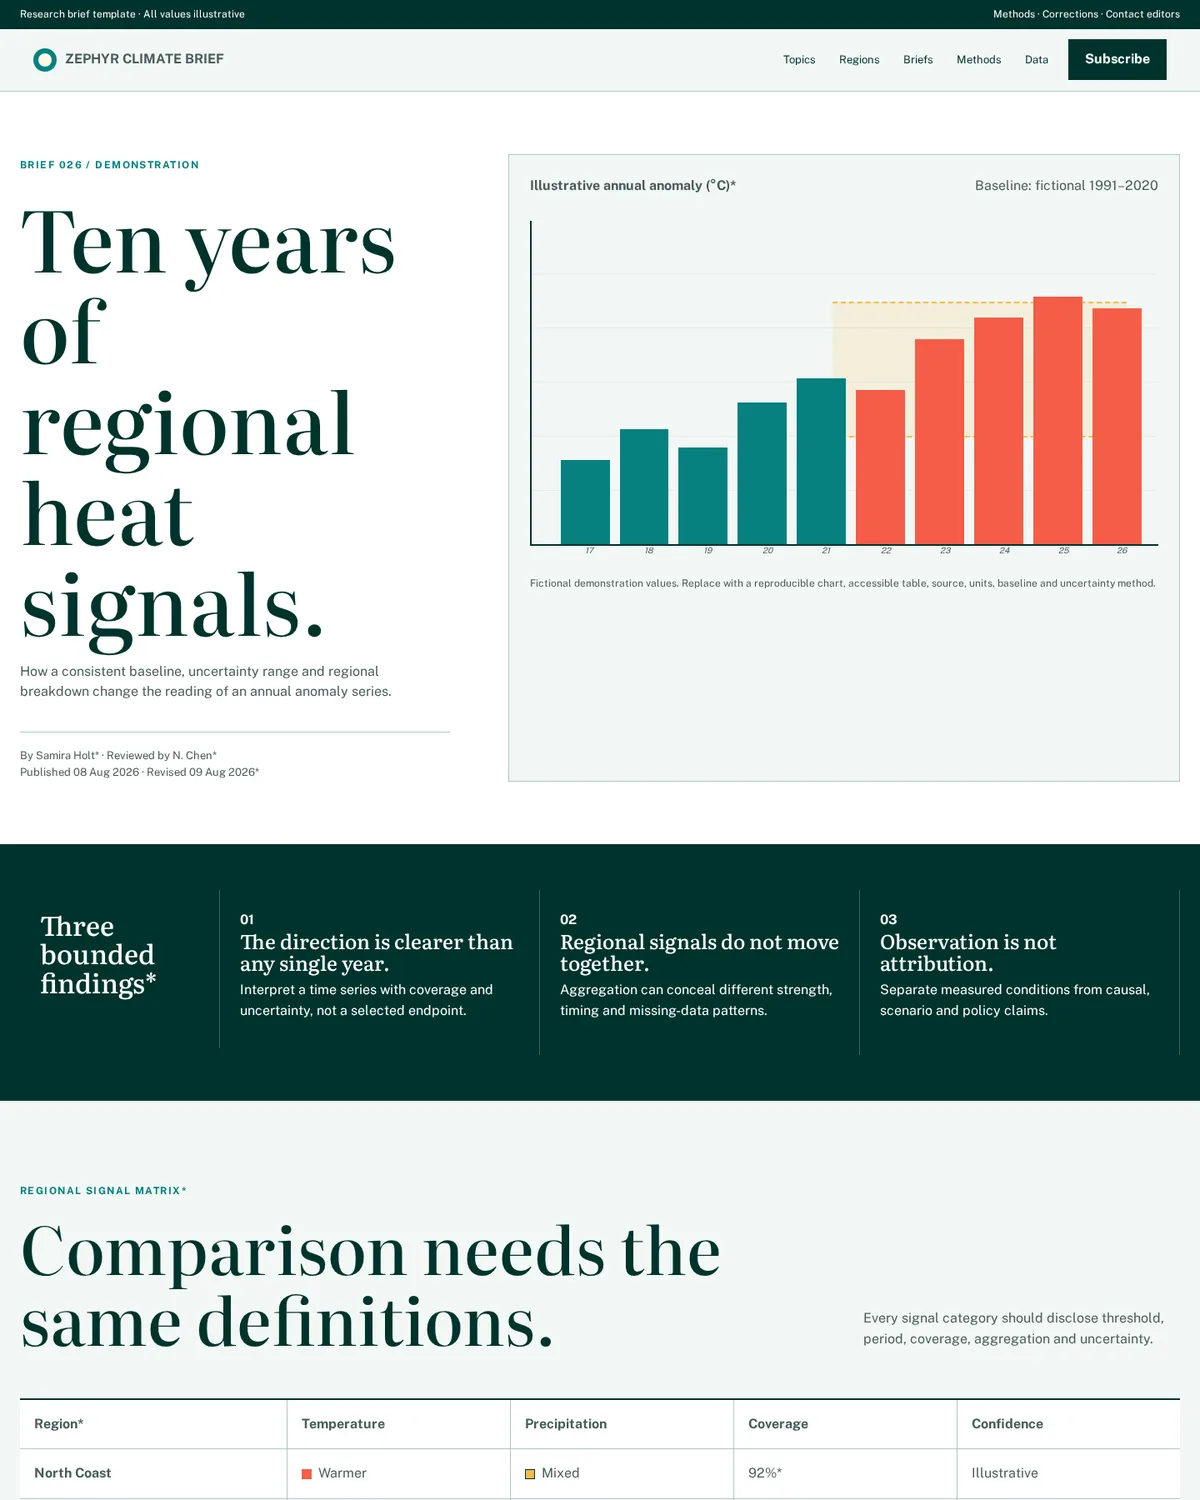
Zephyr opens with one dominant sourced chart and brief metadata, then presents numbered findings, a regional signal matrix, a bounded anomaly map, methods and limitations, policy chronology, reviewed briefs, authors, and datasets. The page prioritizes evidence and provenance instead of climate campaign imagery.
Choose this template for a climate research institute, scientific briefing service, policy observatory, environmental data newsroom, university center, or evidence-led nonprofit.
Replace the Zephyr identity with a transparent logo and compact data mark for charts, downloads, and mobile navigation. Preserve the shared chart and table axes, consistent gutters, readable type, restrained signal colors, and explicit source notes. Every brief should include a stable identifier, title, abstract, author, reviewer, affiliations, publication and revision dates, topic and region tags, methods, data sources, baseline, coverage period, uncertainty, limitations, citations, download formats, license, correction history, and contact. Charts must label axes, units, time periods, baselines, uncertainty, missing data, source, and download route.
Provide a text summary and accessible data table; do not rely on color alone. Maps need legends, projection or geographic caveats, source, date, scale context, and non-map alternatives. Regional signal matrices should define thresholds, aggregation, strength categories, and uncertainty. Clearly distinguish observation, reanalysis, model output, scenario, projection, attribution, forecast, target, and policy statement. Do not compare incompatible datasets or switch baselines without explanation. Policy-watch records should link to primary official sources, name jurisdiction, describe status and dates, and distinguish proposal, adoption, implementation, litigation, and repeal.
Claims about temperature, precipitation, emissions, impacts, trends, consensus, policy effects, or urgency must follow the cited evidence and avoid false precision. Never invent data, maps, papers, agencies, authors, institutions, affiliations, or policy events.
Replace generated charts and maps with reproducible visualizations from licensed authoritative data before launch. Generated numbers must never be published as research. Keep values, uncertainty, citations, dates, controls, and sources in HTML or accessible charts. Alternative text should summarize the main pattern and direct readers to the data table. Download pages need file type, size, schema, variables, units, coverage, version, checksum where useful, license, citation, and contact.
Forms should collect minimal information and use secure systems for embargoed data, peer review, contributor records, and account access.
For SEO, create substantive brief, topic, region, method, author, dataset, and policy pages with unique titles, descriptions, canonical URLs, logical headings, authorship, update dates, citations, and internal links. Apply ScholarlyArticle, Dataset, Person, Organization, or Report structured data only when visible facts match. Prevent filter combinations and alternate chart views from producing duplicate pages.
If multilingual, use qualified scientific translation for terminology, units, uncertainty, captions, methods, and policy names.
On mobile, stack chart and summary in reading order, convert matrices into labeled records, preserve legible axes, and avoid overflow. Maintain keyboard access, visible focus, strong contrast, large targets, reduced motion, screen-reader labels, data tables, and non-color cues. Optional analytics, maps, chart libraries, video, and subscription tools should respect consent.
Before launch, replace all fictional data, charts, maps, authors, institutions, dates, citations, and claims; test charts, tables, downloads, filters, citations, subscriptions, keyboard use, screen readers, responsive layouts, performance, consent, and failures. Add reviewed privacy, terms, accessibility, methodology, data license, peer review, corrections, conflicts, funding, attribution, AI-use, and contact pages, with scientific, editorial, data, accessibility, and technical owners and formal review schedules. Archive every released chart with its source snapshot, transformation code, reviewer decision, accessibility table, checksum, and correction history so later updates remain reproducible and auditable.